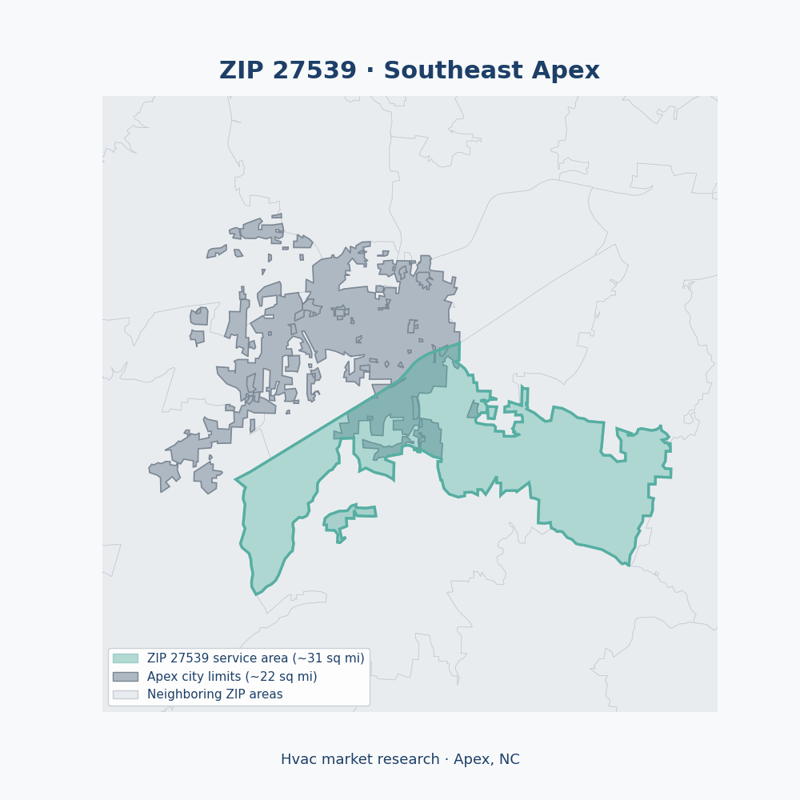
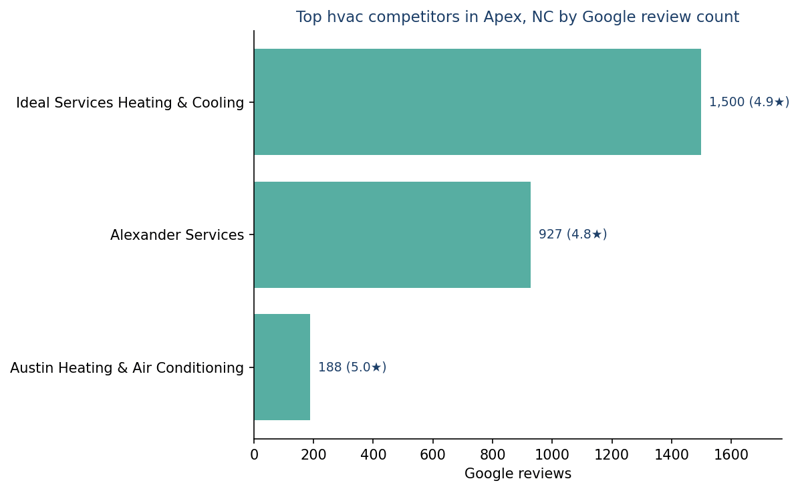
Southeast Apex — the 27539 ZIP straddling the Apex–Holly Springs line — is smaller than Apex's western half but even more affluent. Its roughly 9,068 housing units are 83.1% owner-occupied, median household income reaches $145,947, and the median home is worth $565,600, the highest of the Triangle-south markets studied here. About 37.3% of those homes were built before 2001, so a growing share of original HVAC equipment is entering the replacement window even as the surrounding subdivisions keep adding new construction. What sets 27539 apart is the competitive field: the local map pack is dominated by review-heavy operators, including names with roughly 1,500 and 927 Google reviews and an area average above 2,200 reviews per active contractor. Demand and ability-to-pay are excellent, but breaking into this pack takes a deliberate reputation and service-area plan rather than a generic listing and a hope of being found.
Request the Full ReportSingle ZIP-code service area: 27539 (Southeast Apex) · Market data compiled June 17, 2026.
All figures below are for ZIP code 27539 (Southeast Apex) — a single ZIP-code service area, not all of Apex, NC.
Total population
Source: U.S. Census Bureau, American Community Survey 5-year estimates (via Census Reporter)
Housing units
Source: U.S. Census Bureau, American Community Survey 5-year estimates (via Census Reporter)
Owner-occupancy
Source: U.S. Census Bureau, American Community Survey 5-year estimates (via Census Reporter)
Median home value
Source: U.S. Census Bureau, American Community Survey 5-year estimates (via Census Reporter)
Median household income
Source: U.S. Census Bureau, American Community Survey 5-year estimates (via Census Reporter)
Homes built before 2001
Source: U.S. Census Bureau, American Community Survey 5-year estimates (via Census Reporter)
37.3% of homes built before 2001 means a steady flow of 20-plus-year-old systems reaching end of life across the area's ~9,068 housing units.
At $145,947 median income — the highest of the markets studied — owners favor high-efficiency heat pumps, dual-fuel systems, and indoor-air-quality add-ons over budget swaps.
83.1% owner-occupancy concentrates buying decisions with residents, supporting maintenance agreements and planned, proactive replacements.
A $565,600 median home value reflects owners who invest in comfort and protect equipment with regular service.
Active HVAC contractors
Market saturation
Avg. Google reviews
1500 reviews · 4.9★ (as of June 17, 2026)
927 reviews · 4.8★ (as of June 17, 2026)
188 reviews · 5★ (as of June 17, 2026)
It is the most affluent ZIP in this study by income and home value, with aging housing entering the replacement window. The catch is competition: the local pack is unusually review-heavy, so reputation is the price of entry.
Very. Active contractors average more than 2,200 Google reviews each, and two leaders carry roughly 1,500 and 927 reviews. Winning the map pack requires a sustained review and local-service strategy.
With 37% of homes built before 2001 and the study's highest incomes, demand concentrates in system replacements, high-efficiency heat-pump and dual-fuel upgrades, and indoor-air-quality improvements.
The numbers above are a single-ZIP snapshot. Our Business Expansion Study goes further — we evaluate demand and competition across a full 10-mile radius around a new office location chosen specifically for you, then hand you a ranked plan you can act on.
We rank your strongest territories and size the real, reachable market in a 10-mile radius around each recommended office address — not just one ZIP code.
We search for private office space in buildings with no resident competitor, so your Google Business Profile lands a clean, verifiable address — the #1 driver of new local calls.
Every candidate market is rated on housing demand and competitor saturation, with real priced office listings and a clear #1 recommendation.
The complete study ranks your best satellite-office territories 20–25 miles out, sizes each one across a 10-mile radius, and includes priced office listings and the analysis behind our #1 recommendation.